Geographic Information Systems — GIS — is a visual way to map and geolocate data. There’s Big Money in GIS mapping when it comes to matters of Public Health trends and systems and in proactively predicting the where, how and why crime will appear in your local municipality.
Because New York City is so big and massive and filled with folks from across the socioeconomic spectrum, crime mapping the Big Apple makes for a rich experience.
Here’s a recent, and keen, GIS visualization of SpotCrime’s report for Greenwich Village in New York City:

Here are the gory contextual details of that graphical map.

When you click on the “View Details” link, you drill even deeper into the dark gut of Manhattan with the raw specifics of the reported criminal incidents:

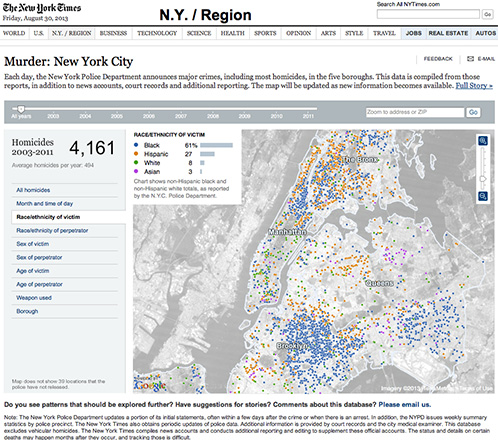
Each day, the New York Police Department announces major crimes, including most homicides, in the five boroughs. This data is compiled from those reports, in addition to news accounts, court records and additional reporting. The map will be updated as new information becomes available.
Here’s a NYTimes report on crime data dated June 2009:
A young boxer was shot dead outside a Bronx bodega at 3:30 a.m. on a Saturday last August. Weeks later, a 59-year-old woman was beaten to death on a Saturday night on the side of a Queens highway. On the last Sunday in September, violence exploded as five men were killed in a spate of shootings and stabbings between midnight and 6 a.m.
Seven homicides in New York City. None connected in any way but this: They happened during the summer months, when the temperatures rise, people hit the streets, and New York becomes a more lethal place.
The quantification of criminal behavior and threats to society is an important aspect of GIS mapping, and we all willingly — or unwillfully! — help add aspect and depth and definition to these numbers when we agree to let our smartphone geographically update our eventful dates and times with geolocation data.
Census data has been mapping us for generations.
We are quickly becoming numerical data points for visual mapping. Our qualitative lives and emotions and residues are being devolved into values with no value: We circle from dust to ash and back to the earth we go.
We are now but mere marketplace commodities and our historical information is bartered and traded on the open markets like hog bellies and cattle futures: From lasso to necktie to noose.
The most dangerous game has always been the human one, but the most profitable game has always been the one with the best reductive numerical quantification of our most basic animalistic behavior — and that includes locating, and predicting, and stopping, the beast in us all.
As an amateur sociologist this fascinates me – to have live data patterns rather than year old statistics which may no longer be relevant – it gives knowledge to enable us to be far more proactive about crime – should we choose to do so. Once fool me twice fool you – three times is a pattern. Rather than looking back and saying I wonder what caused that spike in assaults then – we could get people on the ground investigating and preventing those spikes happening.
That data has always been recorded – just not live and in the now – can I have one for disease control as well please, and one for power outages and surges- I can then add it to this one – which displays human unrest/demonstrations – http://www.popularresistance.org/mapped-every-protest-on-the-planet-since-1979/
the amount of time this would save would be phenomenal ….. you could see real cause and effect
Yes, this is all very “Minority Report” — in that the past predicts the future — but that can be a dangerous pattern because the outlier always catches you off guard and terrible disasters happen. See 9/11 and Hurricane Sandy as two catastrophic examples. Sure, they’re saying Sandy was a 1 in 700 year storm — but what happens in year 700 if you didn’t prepare anything at all for the possibility of the mega storm?
Some crime maps update the second there’s a recorded event. Fire departments and police departments even have fresher data sets in patrol cars and ladder trucks so remote command can be “on the ground” with the responders.
Love that link!
Here’s the FluView interactive data set from the CDC:
http://gis.cdc.gov/grasp/fluview/fluportaldashboard.html
It does live again on October 11 when the flu season officially begins.
Many regional power companies have interactive outage maps. Here’s one for National Grid:
https://www1.nationalgridus.com/PowerOutageMap-NY-RES?ng=us
What I find most fascinating about interactive, live, crime maps is that they put you directly in the behavioral mind of the criminal. Hang around enough and record enough, and you’ll begin to think as they do… we might learn some things we wish we did not want to know…
I am not sure I would go as far as minority report – ie an individual crime prediction tool …….. but the ability for planners to look at real time data is one that appeals to me …. maybe I am not cynical enough about possible misuse of that data.
Becoming a criminal by osmosis ……… now that is kinda scary and definitely moving towards Minority report. The likes of Criminal Minds and CSI and all the profilers out there in Television World would have us believe that is how they catch so many criminals these days – by getting in their minds.
Learning things we wish we didn’t know is all part of life – this might open us up to more etxreme things we wished we did not know though !
Now I am thinking Police will subpoena all google glass records as they happen ……….
The Minority Report angle that wildly concerns me is that we will be arrested before we commit any crime just because the computer thinks we’re going to do something wrong: Guilty Before Behavior.
The NYPD’s now illegal “Stop and Frisk” process was a much dumber and more cruel Minority Report — but the promise is there! — anticipatory incarceration based on age, skin color and “if you belong” in the neighborhood:
http://www.nyclu.org/issues/racial-justice/stop-and-frisk-practices
http://www.nydailynews.com/news/politics/bloomberg-sues-city-council-stop-and-frisk-law-article-1.1444816
I’ve always said the criminal mind is a genius mind — working outside the mainstream and learning creative ways to beat the system — but what if what we learn from the criminal mind is how to become a better criminal and not how to stop the behavior? We’ll become a nation of super criminals preying on each other on the streets and in the courthouses! Or are we already there?
The Google Glass thing is just completely disturbing. The power of an “always on” camera is just too valuable not to be threatening to the sitting majority. They will not only want access, but control — and, in the end, ownership as well.
I’m waiting for the first court ordered punishment of HAVING to wear a Google Glass thing to demonstrate to the court where you are and what you are doing at all times. Forget the ankle bracelet that tracks your vicinity to a home monitor. Now your entire being — even what you watch and look at — can, and shall, be regulated and used against you.